A Demonstration of Python’s Power
Here’s just a quick demonstration of how to accomplish a pretty interesting task, computing and plotting Oceanic Niño Index, in Python. We won’t explain much of what’s going on here, but just want to show how much you can accomplish in Python.
First we just bring in some tools from a variety of Python libraries, using the import command. Python is really powerful at assembling various tools together like lego bricks.
A whole bunch of imports
%matplotlib inline
import warnings
warnings.simplefilter("ignore") # Silence warnings
import xarray as xr
import numpy as np
from matplotlib import pyplot as plt
Read sea surface temperature data
ds = xr.open_dataset("./data/NOAA_NCDC_ERSST_v3b_SST.nc")
ds
sst = ds.sst
Plot mean sst along time dimension
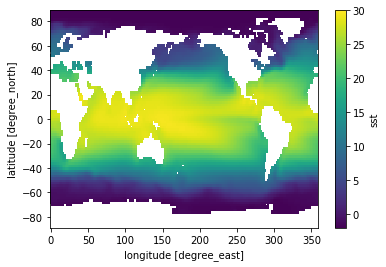
sst.mean(dim='time').plot(vmin=-2, vmax=30)
Plot mean sst along time and longitude dimensions
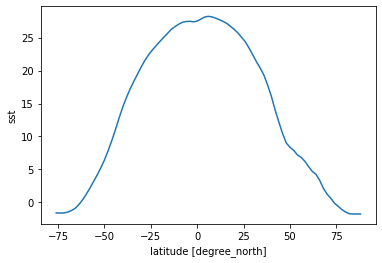
sst.mean(dim=('time', 'lon')).plot()
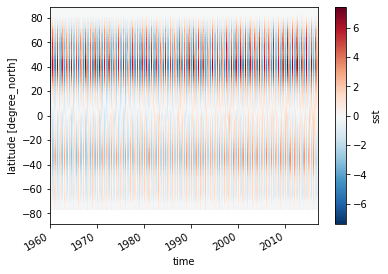
Compute Zonal Anomaly
sst_zonal_time_mean = sst.mean(dim=('time', 'lon'))
(sst.mean(dim='lon') - sst_zonal_time_mean).T.plot()
Plot Data at a specific grid point
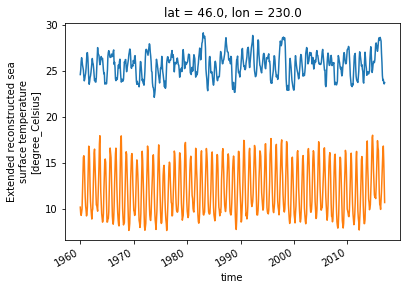
sst.sel(lon=230, lat=0, method='nearest').plot()
sst.sel(lon=230, lat=45, method='nearest').plot()
Compute Climatologies
sst_clim = sst.groupby('time.month').mean(dim='time')
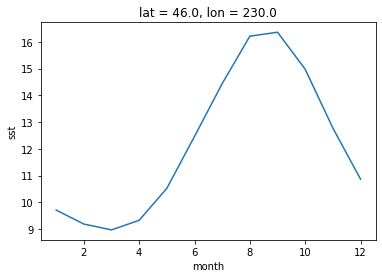
sst_clim.sel(lon=230, lat=45, method='nearest').plot()
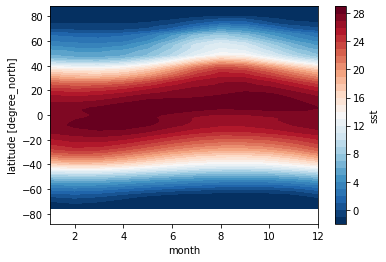
sst_clim.mean(dim='lon').T.plot.contourf(levels=np.arange(-2,30))
sst_anom = sst.groupby('time.month') - sst_clim
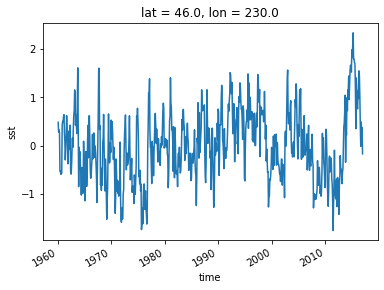
sst_anom.sel(lon=230, lat=45, method='nearest').plot()
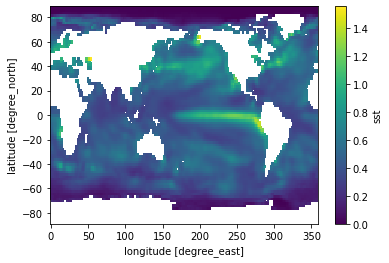
sst_anom.std(dim='time').plot()
Compute El Niño (La Niña) Index
https://www.ncdc.noaa.gov/teleconnections/enso/indicators/sst.php
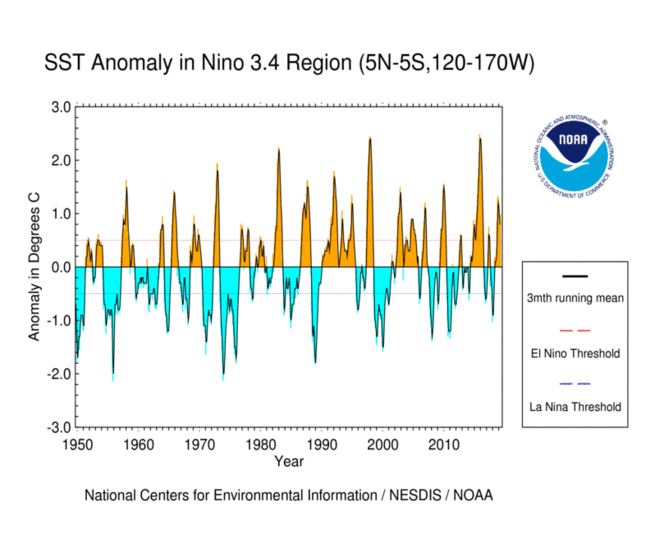
El Niño (La Niña) is a phenomenon in the equatorial Pacific Ocean characterized by a five consecutive 3-month running mean of sea surface temperature (SST) anomalies in the Niño 3.4 region that is above (below) the threshold of +0.5°C (-0.5°C). This standard of measure is known as the Oceanic Niño Index (ONI).
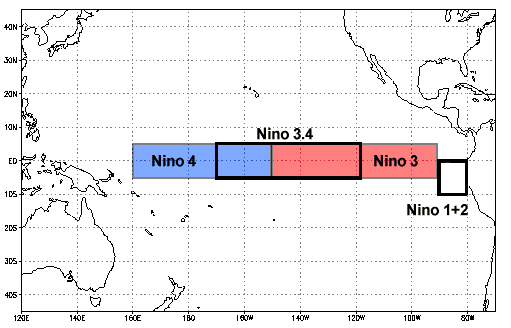
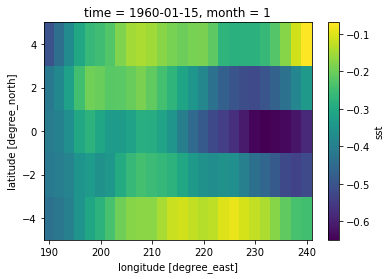
sst_anom_nino34 = sst_anom.sel(lat=slice(-5, 5), lon=slice(190, 240))
sst_anom_nino34[0].plot()
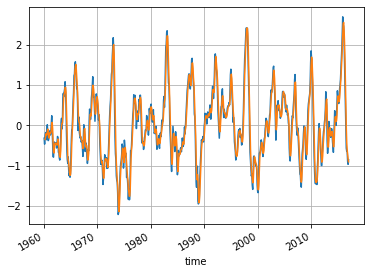
sst_anom_nino34_mean = sst_anom_nino34.mean(dim=('lon', 'lat'))
oni = sst_anom_nino34_mean.rolling(time=3).mean(dim='time')
fig, ax = plt.subplots()
sst_anom_nino34_mean.plot(ax=ax, label='raw')
oni.plot(ax=ax, label='smoothed')
ax.grid()
# create a categorical  dataarray
nino34 = xr.full_like(oni, 'none', dtype='U4')
nino34[oni >= 0.5] = 'nino'
nino34[oni <= -0.5] = 'nina'
nino34
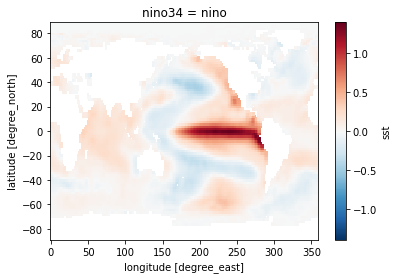
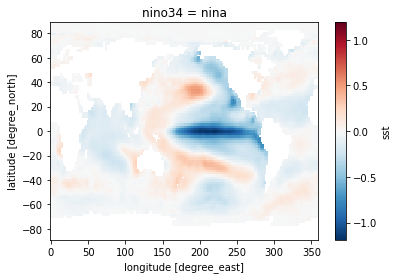
sst_nino_composite = sst_anom.groupby(nino34.rename('nino34')).mean(dim='time')
sst_nino_composite.sel(nino34='nino').plot()
sst_nino_composite.sel(nino34='nina').plot()
nino_ds = xr.Dataset({'nino34': nino34, 'oni': oni}).drop('month')
nino_ds.to_netcdf('./data/nino34_index.nc')
